CAGR vs Average Annual Return: Why Averages Flatter Results
A simple average of yearly returns can make an investment look better than it was. See how CAGR fixes that, where CAGR itself misleads, and how to compare two investments fairly.
- 5 min read
- Published October 11, 2026
- By Ahmed Raza
Key takeaways
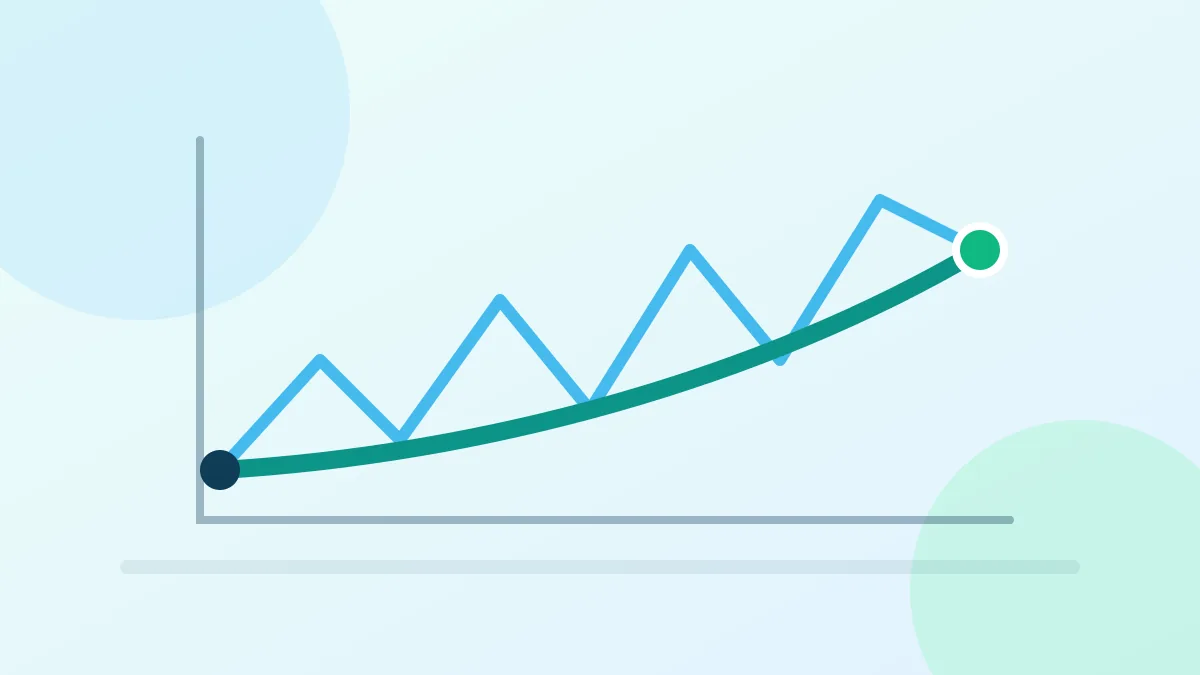
- The simple average of yearly returns ignores compounding, so it overstates growth whenever returns go up and down.
- CAGR is the one steady yearly rate that turns the starting value into the ending value. It describes what actually happened to the money.
- A 50% gain followed by a 50% loss averages 0%, but the money fell by 25%: a CAGR of −13.40% a year.
- CAGR hides the ups and downs, depends on the start and end dates chosen, and gives the wrong answer when you add or withdraw money along the way.
- In US mutual fund prospectuses, the "average annual total return" is already a compound rate, the same idea as CAGR.
On this page
Imagine you invest $10,000. In the first year it gains 50% and grows to $15,000. In the second year it loses 50% and drops to $7,500. What was your average annual return?
If you add the two yearly returns and divide by two, you get (+50% − 50%) ÷ 2 = 0%. That sounds like you broke even. But you started with $10,000 and finished with $7,500, a loss of $2,500. The simple average is telling you something that didn't happen.
This guide explains why that happens, what the compound annual growth rate (CAGR) measures instead, and the situations where even CAGR gives a misleading picture. You can check every example in the CAGR Calculator.
Why does the simple average get it wrong?
Each year's return applies to a different amount of money. The 50% gain was earned on $10,000, but the 50% loss hit $15,000, a bigger base. A loss on a bigger base costs more in dollars than the same percentage gain earned on a smaller one.
That's why a fall always needs a larger rise to recover. After losing 50%, you need a 100% gain just to get back to where you started. A simple average treats +50% and −50% as cancelling out; your account balance doesn't.
What does CAGR measure instead?
CAGR answers a more useful question: what single, steady yearly rate would have turned the starting value into the ending value over the same period?
CAGR = (ending value ÷ starting value)1 ÷ years − 1
For the example above: ($7,500 ÷ $10,000)1/2 − 1 = 0.750.5 − 1 = 0.8660 − 1 = −13.40% a year. Check it: $10,000 × 0.8660 × 0.8660 = $7,500. That's the rate that matches what happened to the money.
How big is the gap in a more normal case?
Most real investments don't swing by 50% a year, but the gap still shows up. Take $10,000 that earns +20%, then −10%, then +15%:
| Year | Return | Value at year end |
|---|---|---|
| 1 | +20% | $12,000 |
| 2 | −10% | $10,800 |
| 3 | +15% | $12,420 |
- Simple average: (20 − 10 + 15) ÷ 3 = 8.33% a year.
- CAGR: ($12,420 ÷ $10,000)1/3 − 1 = 7.49% a year.
- Total return: $2,420 on $10,000, or 24.2% over the three years.
The average overstates the yearly growth by almost a percentage point. The ROI Calculator gives the same 24.2% total and 7.49% annualised figure when you enter three years.
Does volatility really cost money?
Yes, and the example makes it visible. Compare two investments of $10,000 that both have a simple average of 8% a year over three years:
| Yearly returns | Value after 3 years | CAGR | |
|---|---|---|---|
| Steady | +8%, +8%, +8% | $12,597.12 | 8.00% |
| Bumpy | +30%, −10%, +4% | $12,168.00 | 6.76% |
Same average, but the bumpy one ends $429.12 lower. As a general pattern, the more the yearly returns swing around their average, the further the CAGR falls below the simple average. This is why two funds advertising the same "average" return can leave investors with different amounts.
When does CAGR mislead?
CAGR is the better summary of growth, but it's still a single number standing in for a whole history. Three things to watch for:
It hides the ride
The bumpy investment above and a perfectly smooth one growing at 6.76% a year have the same CAGR. CAGR tells you nothing about how deep the falls were along the way, or whether you'd have held on through them.
It depends on the dates chosen
Measure the same three-year example from the end of year 1 instead: $12,000 grows to $12,420 over two years, a CAGR of just 1.73%. Start the clock after a bad year and growth looks strong; start it at a peak and it looks weak. When someone quotes a CAGR, check the period.
It ignores money you add or take out
CAGR only looks at a starting value and an ending value. Suppose you invest $10,000, add another $5,000 at the start of year 2, and have $17,000 at the end of year 3. Feeding $10,000 and $17,000 into the CAGR formula gives 19.35% a year, which is wildly wrong: most of that increase is your own $5,000.
The right approach finds the yearly rate at which both deposits together grow to $17,000, taking into account how long each one was invested. Here that's about 4.80% a year: $10,000 growing for three years plus $5,000 growing for two years at 4.80% comes to about $17,000. Spreadsheets can work this out with their IRR or XIRR functions. Our CAGR Calculator, like the formula, assumes nothing was added or withdrawn.
What do fund documents actually show?
In the US, fund prospectuses report an "average annual total return" for 1, 5 and 10 years. Despite the word "average", the SEC's Form N-1A defines it as a compound rate: the yearly rate that grows a hypothetical $1,000 initial payment to its ending value, using the formula P(1 + T)n = ERV. That's the same idea as CAGR, so it doesn't suffer from the averaging problem in this guide.
Figures you work out yourself, or find on websites and in marketing, may not follow that method. If you see a list of yearly returns and someone has simply averaged them, recalculate the CAGR from the start and end values. For more on judging a fund, see our guide on how to track mutual fund performance.
How to compare two investments fairly
- Use CAGR, or the compound "average annual total return" in fund documents, rather than a simple average of yearly returns.
- Compare over the same start and end dates. A different period can change the answer completely.
- Make sure the ending values include dividends or interest that were paid out or reinvested, so you're comparing total return.
- If money went in or out during the period, use a calculation that accounts for timing (such as XIRR) instead of plain CAGR.
- Look at how bumpy the path was, not just the end result.
- Treat all of it as history. Past growth rates don't predict future ones.
To work out the CAGR of your own investment from what you started with and what it's worth now, use the CAGR Calculator, or the Mutual Fund Return Calculator for a fund holding.
Last reviewed: 11 October 2026. The returns in this guide are invented to show how the measures work; they aren't real investments, predictions or financial advice.
Sources
General information, not financial advice.Read the disclaimer
More guides
 Investment6 min read
Compound Interest: The Eighth Wonder of the World
How compound interest works, with worked examples: why time matters most, how compounding frequency, fees, inflation and taxes affect growth, and why it works against you on debt.
Use with: Compound Interest calculator Investment7 min read
How to Track Mutual Fund Performance: Benchmarks, Ratios & Metrics
How to judge a fund's performance: benchmarks, total return, fees, volatility, drawdown, the Sharpe ratio, alpha and beta, with worked examples. For mutual funds, unit trusts, OEICs and managed funds.
Use with: Mutual Fund Return calculator